| |||||||||||||||||||||||||||||||||||||||||
17 of 51 seats to Derby City Council 26 seats needed for a majority | |||||||||||||||||||||||||||||||||||||||||
|---|---|---|---|---|---|---|---|---|---|---|---|---|---|---|---|---|---|---|---|---|---|---|---|---|---|---|---|---|---|---|---|---|---|---|---|---|---|---|---|---|---|
| |||||||||||||||||||||||||||||||||||||||||
 | |||||||||||||||||||||||||||||||||||||||||
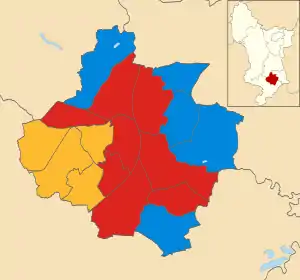
The 2007 Derby City Council election took place on 3 May 2007 to elect members of Derby City Council in England. One third of the council was up for election and the council stayed under no overall control.[1]
The election saw the Conservative Party gain a seat in Chaddesden from the Labour Party. The Labour Party gained one in Darley from the Liberal Democrats.[2] Following the election Labour continued to run the council after they and the Conservatives agreed to continue their agreement, with the Conservatives retaining 3 seats in the cabinet.[3]
After the election, the composition of the council was:
- Labour 24
- Liberal Democrat 13
- Conservative 12
- Independent 2[4]
Election result
| Party | Seats | Gains | Losses | Net gain/loss | Seats % | Votes % | Votes | +/− | |
|---|---|---|---|---|---|---|---|---|---|
| Labour | 8 | 1 | 1 | 47.1 | 34.2 | 20,593 | |||
| Conservative | 5 | 1 | 0 | 29.4 | 32.0 | 19,272 | |||
| Liberal Democrats | 4 | 0 | 1 | 23.5 | 28.8 | 17,393 | |||
| Independent | 0 | 0 | 0 | 0 | 3.7 | 2,237 | |||
| Green | 0 | 0 | 0 | 0 | 1.3 | 806 | New | ||
Ward results
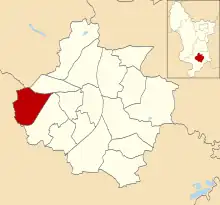
Abbey
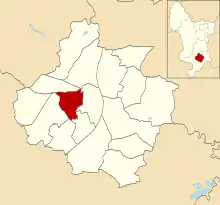
Location of Abbey ward
| Party | Candidate | Votes | % | ±% | |
|---|---|---|---|---|---|
| Liberal Democrats | Bryan Lowe | 1,237 | 44.1 | ||
| Labour | Jaz Greer | 1,093 | 39.0 | ||
| Conservative | Andrew Hill | 327 | 11.7 | ||
| Independent | Norman Clayton | 149 | 5.3 | ||
| Majority | 144 | 5.1 | |||
| Turnout | 2,806 | 29.4 | |||
| Liberal Democrats hold | Swing | ||||
Allestree
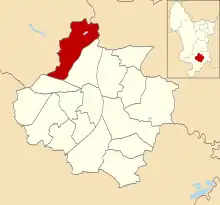
Location of Allestree ward
| Party | Candidate | Votes | % | ±% | |
|---|---|---|---|---|---|
| Conservative | Steve Willoughby | 3,172 | 64.6 | ||
| Labour | Frank Kirkland | 940 | 19.1 | ||
| Liberal Democrats | Simon King | 801 | 16.3 | ||
| Majority | 2,232 | 45.5 | |||
| Turnout | 4,913 | 45.4 | |||
| Conservative hold | Swing | ||||
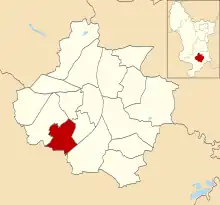
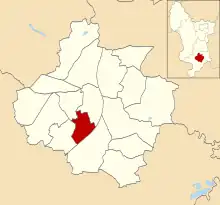
Alvaston
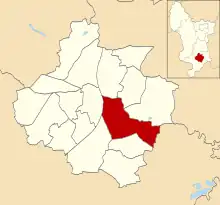
Location of Alvaston ward
| Party | Candidate | Votes | % | ±% | |
|---|---|---|---|---|---|
| Labour | Paul Bayliss | 1,513 | 45.4 | ||
| Liberal Democrats | Naveed Hussain | 1,158 | 34.8 | ||
| Conservative | Alison Hayes | 660 | 19.8 | ||
| Majority | 355 | 10.6 | |||
| Turnout | 3,331 | 30.3 | |||
| Labour hold | Swing | ||||
Arboretum

Location of Arboretum ward
| Party | Candidate | Votes | % | ±% | |
|---|---|---|---|---|---|
| Labour | Fareed Hussain | 1,936 | 49.1 | ||
| Liberal Democrats | Masud Akhtar | 1,461 | 37.1 | ||
| Conservative | Douglas Sice | 270 | 6.8 | ||
| Green | Jane Temple | 162 | 4.1 | ||
| Independent | Josephine Rooney | 114 | 2.9 | ||
| Majority | 475 | 12.0 | |||
| Turnout | 3,943 | 37.4 | |||
| Labour hold | Swing | ||||
Blagreaves
Location of Blagreaves ward
| Party | Candidate | Votes | % | ±% | |
|---|---|---|---|---|---|
| Liberal Democrats | Bob Troup | 1,885 | 45.3 | ||
| Labour | Baggy Shanker | 1,292 | 31.0 | ||
| Conservative | Lisa Marshall | 792 | 19.0 | ||
| Green | Clare Shelton | 194 | 4.7 | ||
| Majority | 593 | 14.3 | |||
| Turnout | 4,163 | 43.1 | |||
| Liberal Democrats hold | Swing | ||||
Boulton
Location of Boulton ward
| Party | Candidate | Votes | % | ±% | |
|---|---|---|---|---|---|
| Labour | Barbara Jackson | 1,269 | 40.0 | ||
| Independent | Brenda Longworth | 870 | 27.5 | ||
| Conservative | David Jennings | 656 | 20.7 | ||
| Liberal Democrats | Grahame Elson | 374 | 11.8 | ||
| Majority | 399 | 12.5 | |||
| Turnout | 3,169 | 31.4 | |||
| Labour hold | Swing | ||||
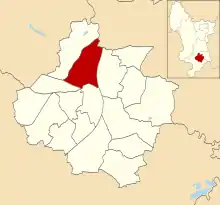
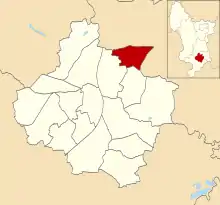
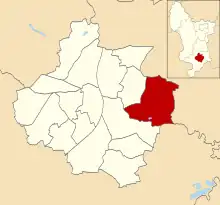
Chaddesden
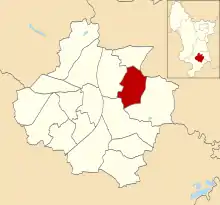
Location of Chaddesten ward
| Party | Candidate | Votes | % | ±% | |
|---|---|---|---|---|---|
| Conservative | Alan Grimadell | 1,588 | 46.1 | ||
| Labour | Anne MacDonald | 1,468 | 42.6 | ||
| Liberal Democrats | David Batey | 388 | 11.3 | ||
| Majority | 120 | 3.5 | N/A | ||
| Turnout | 3,444 | 34.2 | |||
| Conservative gain from Labour | Swing | ||||
Chellaston
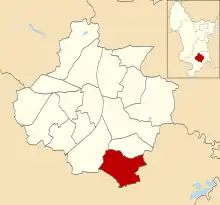
Location of Chellaston ward
| Party | Candidate | Votes | % | ±% | |
|---|---|---|---|---|---|
| Conservative | Harvey Jennings | 1,828 | 45.9 | ||
| Labour | Linda Winter | 1,699 | 42.7 | ||
| Liberal Democrats | Stephen Connolly | 252 | 6.3 | ||
| Independent | David Black | 201 | 5.1 | ||
| Majority | 129 | 3.2 | |||
| Turnout | 3,980 | 37.2 | |||
| Conservative hold | Swing | ||||
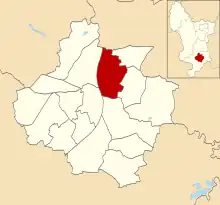
Darley
Location of Darley ward
| Party | Candidate | Votes | % | ±% | |
|---|---|---|---|---|---|
| Labour | Martin Repton | 1,198 | 32.7 | ||
| Liberal Democrats | Roger Jackson | 1,168 | 31.8 | ||
| Conservative | Lorraine Radford | 964 | 26.3 | ||
| Green | David Clasby | 338 | 9.2 | ||
| Majority | 30 | 0.9 | N/A | ||
| Turnout | 3,668 | 40.0 | |||
| Labour gain from Liberal Democrats | Swing | ||||
Derwent
Location of Derwent ward
| Party | Candidate | Votes | % | ±% | |
|---|---|---|---|---|---|
| Labour | Martin Rawson | 1,170 | 50.5 | ||
| Conservative | Philip Lucas | 598 | 25.8 | ||
| Independent | William Wright | 299 | 12.9 | ||
| Liberal Democrats | Leigh Alcock | 252 | 10.9 | ||
| Majority | 572 | 24.7 | |||
| Turnout | 2,319 | 23.4 | |||
| Labour hold | Swing | ||||
Littleover
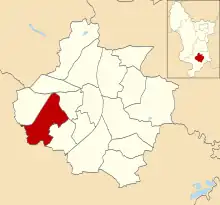
Location of Littleover ward
| Party | Candidate | Votes | % | ±% | |
|---|---|---|---|---|---|
| Liberal Democrats | Mike Carr | 2,359 | 55.2 | ||
| Conservative | Mike Cook | 1,333 | 31.2 | ||
| Labour | Linda McGraw | 583 | 13.6 | ||
| Majority | 1,026 | 24.0 | |||
| Turnout | 4,275 | 42.3 | |||
| Liberal Democrats hold | Swing | ||||
Mackworth
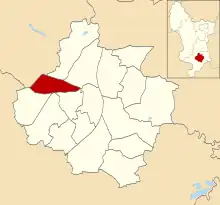
Location of Mackworth ward
| Party | Candidate | Votes | % | ±% | |
|---|---|---|---|---|---|
| Labour | Lisa Higginbottom | 1,325 | 48.7 | ||
| Liberal Democrats | Simon Lyszczenko | 702 | 25.8 | ||
| Conservative | Andrew Brown | 692 | 25.5 | ||
| Majority | 623 | 22.9 | |||
| Turnout | 2,719 | 29.1 | |||
| Labour hold | Swing | ||||
Mickleover
Location of Mickleover ward
| Party | Candidate | Votes | % | ±% | |
|---|---|---|---|---|---|
| Liberal Democrats | Maggie Hird | 2,758 | 55.5 | ||
| Conservative | Matthew Holmes | 1,797 | 36.2 | ||
| Labour | Joga Thind | 415 | 8.4 | ||
| Majority | 961 | 19.3 | |||
| Turnout | 4,970 | 45.0 | |||
| Liberal Democrats hold | Swing | ||||
Normanton
Location of Normanton ward
| Party | Candidate | Votes | % | ±% | |
|---|---|---|---|---|---|
| Labour | Amar Nath | 1,764 | 48.7 | ||
| Liberal Democrats | Abdul Majid | 1,522 | 42.0 | ||
| Conservative | Jawaid Iqbal | 336 | 9.3 | ||
| Majority | 242 | 6.7 | |||
| Turnout | 3,622 | 34.2 | |||
| Labour hold | Swing | ||||
Oakwood
Location of Oakwood ward
| Party | Candidate | Votes | % | ±% | |
|---|---|---|---|---|---|
| Conservative | Robin Wood | 1,358 | 44.9 | ||
| Labour | Phil Woodhead | 711 | 23.5 | ||
| Independent | Frank Harwood | 604 | 20.0 | ||
| Liberal Democrats | Eric Ashburner | 238 | 7.9 | ||
| Green | Stephen Shelton | 112 | 3.7 | ||
| Majority | 647 | 21.4 | |||
| Turnout | 3,023 | 29.9 | |||
| Conservative hold | Swing | ||||
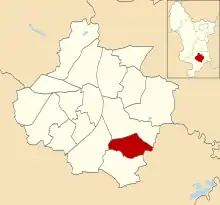
Sinfin
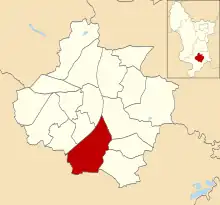
Location of Sinfin ward
| Party | Candidate | Votes | % | ±% | |
|---|---|---|---|---|---|
| Labour | Prem Chera | 1,321 | 55.6 | ||
| Conservative | Patrick Fullarton | 592 | 24.9 | ||
| Liberal Democrats | Joe Naitta | 465 | 19.6 | ||
| Majority | 729 | 30.7 | |||
| Turnout | 2,378 | 24.8 | |||
| Labour hold | Swing | ||||
Spondon
Location of Spondon ward
| Party | Candidate | Votes | % | ±% | |
|---|---|---|---|---|---|
| Conservative | Peter Berry | 2,309 | 64.5 | ||
| Labour | Chris Wynn | 896 | 25.0 | ||
| Liberal Democrats | John-Paul Keane | 373 | 10.4 | ||
| Majority | 1,413 | 39.5 | |||
| Turnout | 3,578 | 37.3 | |||
| Conservative hold | Swing | ||||
References
- ↑ "Derby". BBC News Online. Retrieved 3 October 2009.
- ↑ "Local Elections 2007". BBC Online. 6 May 2007. Retrieved 3 October 2009.
- ↑ Green, Kirsty (17 May 2007). "Labour and Tories agree a new deal". Derby Evening Telegraph. p. 13.
- 1 2 "Results". The Times. 5 May 2007. p. 83.
- 1 2 3 4 5 6 7 8 9 10 11 12 13 14 15 16 17 "Election 2007 - Results". Derby City Council. Archived from the original on 7 September 2007. Retrieved 5 October 2009.
This article is issued from Wikipedia. The text is licensed under Creative Commons - Attribution - Sharealike. Additional terms may apply for the media files.